What an Article Is Actually Worth
Pricing an article: volume, realistic CTR, conversion and payback. Why most return nothing, and why the Value map figure is a sorting device, not a forecast.
Updated Sep 9, 2026 · 9 min read
Nobody asks this question until about month five, which is a shame, because the answer changes what you write.
An article is worth the traffic it earns, times the chance that traffic buys something, times what that purchase is worth to you. Four numbers, three of which you already have.
This page is how to do that arithmetic honestly, why most of your articles will be worth almost nothing and a handful will be worth a great deal, how long payback actually takes, and the point at which writing another one is the wrong move.
The arithmetic, in four numbers
Take one keyword and walk it through.
- Monthly search volume. From the Keywords table. Use the combined figure if the keyword has variants, because they are the same article.
- Realistic click-through at the position you expect to reach. Not position 1. The position you will plausibly hold in a year.
- Conversion rate for blog traffic. Your own number if you have it. If not, 0.5% to 1% for an ecommerce blog and 1% to 3% for a B2B site are defensible starting points, and both are lower than people expect.
- Value per conversion. Gross profit, not revenue. An order worth 200 at 40% margin is worth 80 to you.
Multiply them. That is the article's monthly value, and it is usually smaller and more sobering than the search volume made it look.
| Position you reach | Realistic CTR | Visits from 3,600 volume |
|---|---|---|
| 1 | 25 to 30% | 900 to 1,080 |
| 2 to 3 | 10 to 16% | 360 to 576 |
| 4 to 6 | 5 to 9% | 180 to 324 |
| 7 to 10 | 2 to 4% | 72 to 144 |
| 11 to 20 | Under 1% | Under 36 |
The mistake that makes every forecast wrong: modelling on position 1. Plan on positions 4 to 8, because that is where a good article on a mid-sized site lands, and treat anything better as a bonus. A plan built on position 1 is off by a factor of five before you start.
Most articles are worth nothing, and that is the model working
Content returns follow a power law, not an average. This is the most important thing on this page and the one that gets designed around least.
A typical portfolio of 40 published articles, after a year, looks roughly like this. Three or four carry the site, six or eight contribute something, and the rest sit somewhere between a rounding error and zero.
Which means the average article is a fiction. There is no average article, there is a distribution, and planning on the mean will disappoint you every time.
Two practical consequences follow, and they point in opposite directions from the usual advice.
- Volume of attempts matters more than perfecting each one. You cannot reliably predict which four articles will carry the site. You can only take enough shots that four of them land.
- Once a winner shows itself, it deserves disproportionate attention. An article already at position 6 with real traffic will return more from two hours of improvement than a new article will return from eight.
Write broadly to find the winners, then feed the winners. Doing only the first is how blogs plateau, and doing only the second is how they never start.
Payback takes longer than anyone budgets for
The cost of an article is not the subscription. On Growth at 149 a month for 50 articles the tool cost is roughly 2.98 per article, which is not the number that matters.
The real cost is your time: reviewing the outline, checking facts, adding the paragraph only you could write, and publishing. Call it 30 to 60 minutes per article, and price your own hour honestly.
Then add the thing that makes content different from ads: the delay. An article earns nothing for months and then earns for years.
| Month | What is happening | Cumulative return |
|---|---|---|
| 0 | Written, published, cost incurred | Negative |
| 1 to 3 | Indexed, drifting up from the 60s | Still negative |
| 4 to 6 | Crossing into page two, then page one | Approaching break-even |
| 7 to 12 | Settled position, steady traffic | Positive, and compounding |
| Year 2 onward | Maintenance only | The reason anyone does this |
Six to nine months to break even on a single article is normal on an established site. On a new domain, twelve is normal, and anyone quoting you three is either lucky or selling something.
The compounding is what makes it worth it. An article that pays back in month eight has typically returned several times its cost by month thirty, and it has done that without you touching it.
Being straight about the Value map number
Your Authority Map has a Value map tab that opens with a large figure and the words This niche is worth. It is genuinely useful and it is not a forecast, so it is worth knowing exactly what it is made of.
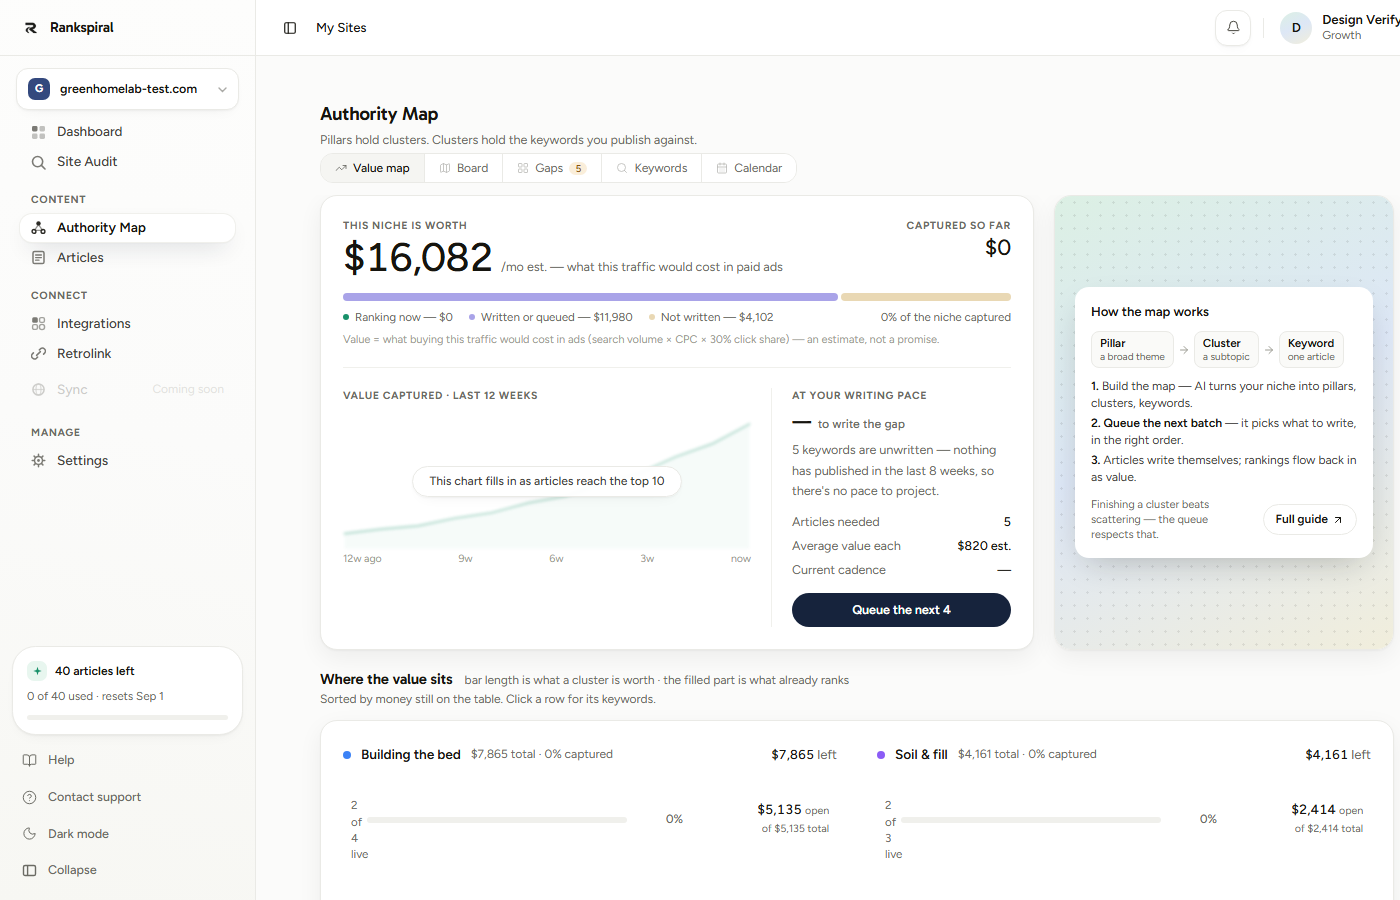
The formula is printed under the bar, and the product does not hide it: search volume times cost per click times a flat 30% click share. The interface calls it an estimate rather than a promise, and it is right to.
Three things that flat 30% is doing, all of which inflate the number relative to what you will actually earn:
- It assumes you take 30% of the clicks for every keyword, at every position. In reality 30% is roughly what position 1 earns, and most of your keywords will not be at position 1.
- It prices a click at what an advertiser would pay, which is set by people bidding on purchase intent. An informational visitor is worth a fraction of that to you.
- The captured figure counts any keyword whose article ranks in the top ten at full value. Ranking ninth and ranking first are not the same business, and this number treats them as one.
So what is it good for? Sorting. It is a consistently calculated score across every keyword in your map, which makes it excellent at answering which of two clusters is worth more, useless at answering how much you will make, and a good way to decide the order of work rather than to fill in a business plan.
The same caution applies to At your writing pace, on the right of the same tab. It divides remaining keywords by your published-per-week rate over the last eight weeks and tells you how many weeks the gap takes to write. It is honest about its own limits: the panel itself says rankings decide when the value lands.
A worked example
A shop selling beekeeping starter kits and hive equipment. Average order 185, gross margin 38%, so 70 of profit per order.
Their best article targets how to start beekeeping uk: volume 3,600, difficulty 29, CPC 0.90.
What the Value map said. 3,600 times 0.90 times 0.3 gives 972 a month. A large, encouraging number.
What actually happened. Fourteen months after publishing, the article holds position 4.
| Step | Number |
|---|---|
| Volume | 3,600 |
| CTR at position 4 | 6% |
| Visits per month | 216 |
| Conversion to order | 0.8% |
| Orders per month | 1.7 |
| Gross profit per order | 70 |
| Monthly value | 121 |
The Value map said 972. The article returns 121. That is roughly eight times off, and it is off in a completely predictable direction.
Which does not make the number useless. It ranked this keyword above the other 60 in the map, and it was right to: this is their best article. It was a good sorting decision and a terrible forecast.
Payback on that one article: 45 minutes of review time at 50 an hour, plus a few pounds of tool cost, is about 41. It first earned meaningfully in month six, and it had returned its cost several times over by month eight.
Now the rest of the portfolio
Thirty-eight published articles at fourteen months, sorted by monthly gross profit contributed:
| Band | Articles | Monthly value each | Share of total |
|---|---|---|---|
| Carrying the site | 4 | 85 to 121 | 68% |
| Contributing | 7 | 12 to 40 | 24% |
| Barely moving | 8 | 2 to 8 | 8% |
| Zero | 19 | 0 | 0% |
Half the articles produced nothing at all. That is not a failure rate, that is the distribution, and it is what the four winners cost to find.
The decision this table produced was to stop writing for a month and spend it on the seven in the contributing band, all of which sat between positions 11 and 19. Five moved onto page one. The portfolio's monthly value rose 40% without a single new article.
When to stop writing and start refreshing
There is a crossover point, and it arrives earlier than most people switch.
The logic is simple. A new article is a lottery ticket with a six-month delay. An article sitting at position 13 is a known quantity, three places from a large step change in clicks, and fixable in two hours.
Three concrete triggers. Any one of them means your next week goes to refreshing.
- You have 25 or more published articles and 8 or more of them sit between positions 11 and 20. Check the Striking distance card on your dashboard, which lists that band directly.
- Your best five articles have not been touched in nine months. Decay is quiet, and your winners are what you can least afford to lose.
- Your last ten articles have all landed outside the top 30. That is a targeting problem, and writing an eleventh will not solve it.
The ratio worth settling into once you have a real back catalogue is three weeks writing to one week refreshing. Before 20 published articles, write. After 50, the refresh week is usually your highest-return week of the month.
Run the number on your own best article
Twenty minutes, once, and it will change what you write next.
Take your highest-traffic article and put real numbers through the four steps. Search Console gives you the clicks, your analytics gives you the conversion rate, and you know your own margin. Multiply.
Then do the same for your worst-performing recent article and compare the two keywords. Nine times out of ten the difference is not writing quality, it is that one keyword had buyers behind it and the other had browsers.
Write down the resulting number per article and use it as your budget. If a good article in your niche is worth 120 a month, spending six hours on one is defensible and spending twenty is not.
The Authority Map: reading the Value map tab→ Measuring results: the four numbers that matter→ Content refreshing: when to refresh, rewrite or consolidate→ Publishing cadence: how often should you actually publish→ Choosing a niche you can actually rank in→The uncomfortable truth about content ROI is that you cannot pick the winners in advance, and you can absolutely tell which ones they were afterwards.
So the job is to take enough swings, and then to notice.
Was this page useful?
Tell us what was missing and we'll fix the page.